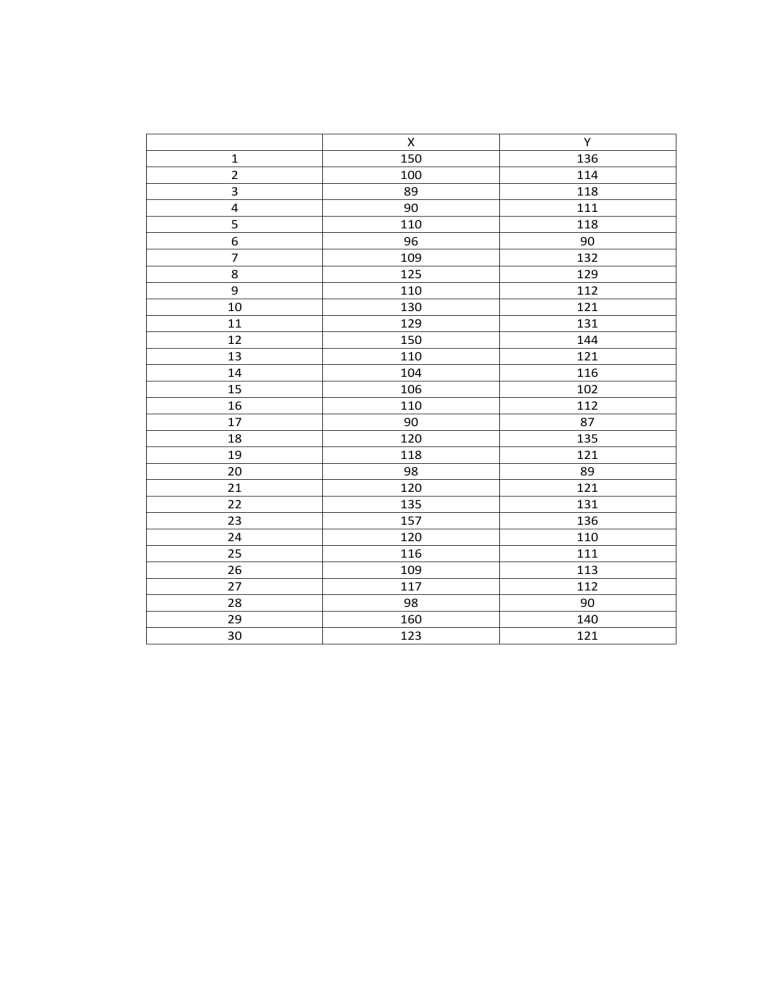
1 2 3 4 5 6 7 8 9 10 11 12 13 14 15 16 17 18 19 20 21 22 23 24 25 26 27 28 29 30 X 150 100 89 90 110 96 109 125 110 130 129 150 110 104 106 110 90 120 118 98 120 135 157 120 116 109 117 98 160 123 Y 136 114 118 111 118 90 132 129 112 121 131 144 121 116 102 112 87 135 121 89 121 131 136 110 111 113 112 90 140 121 Tests of Normality Kolmogorov-Smirnova Statistic df Shapiro-Wilk Sig. Statistic df Sig. orangtua .135 30 .171 .934 30 .063 anak .145 30 .106 .944 30 .119 Werwerewrf a. Analisis dari Hasil Test Of Normality Jika probabilitas (sig) > α 0,05, maka data berdisribusi normal Jika probabilitas (sig) > α 0,05, maka data tidak berdistribusi normal b. Dari tabel diatas dapat ditarik kesimpulan 1) Varibael orangtua (sig) > α = (0,17) > 0,05 maka data berdistribusi normal 2) Variable anak (sig) > α = (0,10) > 0,05 maka data berdistribusi normal Test of Homogeneity of Variances Levene Statistic orangtua anak df1 df2 Sig. .583 1 28 .451 1.398 1 28 .247 Analisis: a) Varibael Kompetensi Intrapersonal memilliki nilai signifikansi sebesar 0,832. Nilai ini menunjukkan bahwa nilai (sig) > α = (0,832) > 0,05, maka dapat disimpulkan data Kompetensi Intrapersonal memiliki variable yang sama. b) Variable motif berprestasi memilliki nilai signifikansi sebesar 0,511. Nilai ini menunjukkan bahwa nilai (sig) > α = (0,511) > 0,05, maka dapat disimpulkan data Motif Berprestasi memiliki variable yang sama Descriptive Statistics Mean Std. Deviation N anak 117.47 15.233 30 orangtua 116.63 19.206 30 Correlations anak anak orangtua 1.000 .784 .784 1.000 . .000 .000 . anak 30 30 orangtua 30 30 Pearson Correlation orangtua anak Sig. (1-tailed) orangtua N Variables Entered/Removeda Model 1 Variables Entered Variables Removed orangtuab Method . Enter a. Dependent Variable: anak b. All requested variables entered. Model Summaryb Model R R Square Adjusted R Square Change Statistics Std. Error of the Estimate R Square Change 1 .784a .615 .601 9.625 .615 F Change 44.640 df1 1 Model Summaryb Model Change Statistics df2 1 a. Predictors: (Constant), orangtua b. Dependent Variable: anak Sig. F Change 28a .000 ANOVAa Model 1 Sum of Squares df Mean Square Regression 4135.525 1 4135.525 Residual 2593.942 28 92.641 Total 6729.467 29 F Sig. .000b 44.640 a. Dependent Variable: anak b. Predictors: (Constant), orangtua Coefficientsa Model Unstandardized Coefficients B (Constant) t Standardized Coefficients Std. Error Sig. Beta 44.947 10.995 .622 .093 4.088 .000 6.681 .000 1 orangtua .784 Coefficientsa Model 95.0% Confidence Interval for B Lower Bound (Constant) Upper Bound 22.424 67.470 .431 .812 1 orangtua a. Dependent Variable: anak Residuals Statisticsa Minimum Predicted Value Maximum Mean Std. Deviation N 100.28 144.43 117.47 11.942 30 -16.881 19.280 .000 9.458 30 Std. Predicted Value -1.439 2.258 .000 1.000 30 Std. Residual -1.754 2.003 .000 .983 30 Residual a. Dependent Variable: anak Analisis uji statistik: a. Tabel descriptive diatas dapat dianalisis sebagai berikut. 1) Jumlah responden 30 orang 2) Rata-rata anak sebesar 117,47 dengan standar deviasi sebesar 15,233, artinya jika dihubungkan antara rata-rata dengan standar deviasi maka variabel anak akan berkisar antara 15,233 kurang lebih 117,47 3) Rata-rata orangtua sebesar 116,63 dengan standar deviasi sebesar 19,206 b. Analisis hasil regresi linear 1) Tabel descriptive statistics diatas dapat dianalisis sebagai berikut. (a) Jumlah responden 30 orang (b) Rata-rata anak sebesar 117,47 dengan standar deviasi sebesar 15,233. Standar deviasi sebesar 15,233 artinya jika hubungan dengan rata-rata motif berprestasi sebesar 117,47, maka motif berprestasi akan berkisar antara 117,47 kurang lebih 15,233 dengan rata-rata orangtua 116,63 2) Tabel model summary diatas dapat dianalisis sebagai berikut. (a) Menunjukkan bahwa hubungan (korelasi) antara orangtua dengan empati anak sangat kuat positif, yaitu r = 0,784, arti positif adalah hubungan antara variabel X dan Y searah. Searah dimaksudkan adalah semakin besar hasil prestasi belajar maka semakin meningkat motif berprestasi. (b) Konstribusi yang disumbangkan orangtua (X) terhadap emapati anak (Y) = 78,4% 3) Tabel anova diatas dapat dianalisis sebagai berikut. (a) Membuat hipotesis dalam uraian kalimat H0 : Model regresi linear sederhana tidak dapat digunakan untuk memprediksi motif berprestasi yang dipengaruhi oleh prestasi belajar. Ha : Model regresi linear sederhana dapat digunakan untuk memprediksi motif berprestasi yang dipengaruhi oleh prestasi belajar. (b) Kaidah pengujian (1) Berdasarkan perbandingan antara Fhitung dan Ftabel Jika : Fhitung ≤ Ftabel, maka H0 diterima. Jika : Fhitung > Ftabel, maka H0 ditolak Nilai Fhitung dari tabel anova sebesar 101,533 dan nilai Ftabel sebesar 4,20 (2) Berdasarkan nilai probabilitas Jika probabilitas (sig) > α maka H0 diterima. Jika probabilitas (sig) < α maka H0 ditolak. Dari tabel anova nilai probabilitas (sig) = 0,00 dan nilai taraf signifikan α = 0,05. (c) Membandingkan Ftabel dan Fhitung serta sig dan α Ternyata : Fhitung = 44,640 > Ftabel = 4,20 , maka H0 ditolak. Ternyata : (sig) F < α = 0,00 < 0,05, maka H0 ditolak. (d) Keputusan Model regresi linear sederhana dapat digunakan untuk memprediksi motif berprestasi yang dipengaruhi oleh prestasi belajar. 4) Tabel coefficients diatas dapat dianalisis, sebagai berikut. Tabel coefficients menunjukkan bahwa model persamaan regresi untuk memperkirakan motif berprestasi yang dipengaruhi oleh prestasi belajar adalah Y = 44,947 + 0,622 X. Y adalah empati anak sedangkan X adalah orangtua. EXAMINE VARIABLES=orangtua anak /PLOT STEMLEAF HISTOGRAM NPPLOT /STATISTICS DESCRIPTIVES /CINTERVAL 95 /MISSING LISTWISE /NOTOTAL. Explore Notes Output Created 31-DEC-2019 11:46:48 Comments Input Active Dataset DataSet0 Filter <none> Weight <none> Split File <none> N of Rows in Working Data 30 File User-defined missing values Definition of Missing for dependent variables are treated as missing. Missing Value Handling Statistics are based on cases Cases Used with no missing values for any dependent variable or factor used. EXAMINE VARIABLES=orangtua anak /PLOT STEMLEAF HISTOGRAM NPPLOT /STATISTICS Syntax DESCRIPTIVES /CINTERVAL 95 /MISSING LISTWISE /NOTOTAL. Processor Time 00:00:01,61 Elapsed Time 00:00:01,79 Resources [DataSet0] Case Processing Summary Cases Valid N Missing Percent N Total Percent N Percent orangtua 30 100.0% 0 0.0% 30 100.0% anak 30 100.0% 0 0.0% 30 100.0% Descriptives Statistic Mean 95% Confidence Interval for Mean 116.63 Lower Bound 109.46 Upper Bound 123.80 5% Trimmed Mean 115.80 Median 113.00 Variance orangtua Std. Error 3.506 368.861 Std. Deviation 19.206 Minimum 89 Maximum 160 Range 71 Interquartile Range 23 Skewness .744 .427 Kurtosis .089 .833 117.47 2.781 Mean 95% Confidence Interval for Mean Lower Bound 111.78 Upper Bound 123.15 5% Trimmed Mean 117.72 Median 118.00 anak Variance Std. Deviation 232.051 15.233 Minimum 87 Maximum 144 Range 57 Interquartile Range 20 Skewness -.419 .427 Kurtosis -.235 .833 Tests of Normality Kolmogorov-Smirnova Statistic df Shapiro-Wilk Sig. Statistic df Sig. orangtua .135 30 .171 .934 30 .063 anak .145 30 .106 .944 30 .119 a. Lilliefors Significance Correction orangtua orangtua Stem-and-Leaf Plot Frequency Stem & Leaf 1,00 8. 9 5,00 9 . 00688 5,00 10 . 04699 7,00 11 . 0000678 6,00 12 . 000359 2,00 13 . 05 ,00 14 . 2,00 15 . 00 2,00 Extremes (>=157) Stem width: Each leaf: 10 1 case(s) anak anak Stem-and-Leaf Plot Frequency Stem & Leaf 2,00 8 . 79 2,00 9 . 00 1,00 10 . 2 11,00 11 . 01122234688 6,00 12 . 111119 6,00 13 . 112566 2,00 14 . 04 Stem width: Each leaf: 10 1 case(s) ONEWAY orangtua anak BY VAR00001 /STATISTICS HOMOGENEITY /MISSING ANALYSIS. Oneway Notes Output Created 31-DEC-2019 11:47:19 Comments Input Active Dataset DataSet0 Filter <none> Weight <none> Split File <none> N of Rows in Working Data 30 File Definition of Missing User-defined missing values are treated as missing. Statistics for each analysis Missing Value Handling Cases Used are based on cases with no missing data for any variable in the analysis. ONEWAY orangtua anak BY VAR00001 Syntax /STATISTICS HOMOGENEITY /MISSING ANALYSIS. Processor Time 00:00:00,02 Elapsed Time 00:00:00,10 Resources [DataSet0] Test of Homogeneity of Variances Levene Statistic orangtua anak df1 df2 Sig. .583 1 28 .451 1.398 1 28 .247 ANOVA Sum of Squares Between Groups orangtua Mean Square 28.512 1 28.512 Within Groups 10668.455 28 381.016 Total 10696.967 29 276.376 1 276.376 Within Groups 6453.091 28 230.468 Total 6729.467 29 Between Groups anak df REGRESSION /DESCRIPTIVES MEAN STDDEV CORR SIG N /MISSING LISTWISE /STATISTICS COEFF OUTS CI(95) R ANOVA CHANGE /CRITERIA=PIN(.05) POUT(.10) /NOORIGIN /DEPENDENT anak F Sig. .075 .786 1.199 .283 /METHOD=ENTER orangtua /SCATTERPLOT=(*ZPRED ,anak) /RESIDUALS HISTOGRAM(ZRESID) NORMPROB(ZRESID) /CASEWISE PLOT(ZRESID) OUTLIERS(3). Regression Notes Output Created 31-DEC-2019 11:50:13 Comments Input Active Dataset DataSet0 Filter <none> Weight <none> Split File <none> N of Rows in Working Data 30 File Definition of Missing Missing Value Handling User-defined missing values are treated as missing. Statistics are based on cases Cases Used with no missing values for any variable used. REGRESSION /DESCRIPTIVES MEAN STDDEV CORR SIG N /MISSING LISTWISE /STATISTICS COEFF OUTS CI(95) R ANOVA CHANGE /CRITERIA=PIN(.05) POUT(.10) /NOORIGIN Syntax /DEPENDENT anak /METHOD=ENTER orangtua /SCATTERPLOT=(*ZPRED ,anak) /RESIDUALS HISTOGRAM(ZRESID) NORMPROB(ZRESID) /CASEWISE PLOT(ZRESID) OUTLIERS(3). Resources Processor Time 00:00:00,86 Elapsed Time 00:00:00,83 Memory Required Additional Memory Required for Residual Plots [DataSet0] 1380 bytes 912 bytes Descriptive Statistics Mean Std. Deviation N anak 117.47 15.233 30 orangtua 116.63 19.206 30 Correlations anak anak orangtua 1.000 .784 .784 1.000 . .000 .000 . anak 30 30 orangtua 30 30 Pearson Correlation orangtua anak Sig. (1-tailed) orangtua N Variables Entered/Removeda Model 1 Variables Variables Entered Removed orangtuab a. Dependent Variable: anak b. All requested variables entered. Method . Enter Model Summaryb Model R R Square Adjusted R Std. Error of the Square Estimate Change Statistics R Square F Change df1 Change .784a 1 .615 .601 9.625 .615 44.640 1 Model Summaryb Model Change Statistics df2 Sig. F Change 28a 1 .000 a. Predictors: (Constant), orangtua b. Dependent Variable: anak ANOVAa Model 1 Sum of Squares df Mean Square Regression 4135.525 1 4135.525 Residual 2593.942 28 92.641 Total 6729.467 29 a. Dependent Variable: anak b. Predictors: (Constant), orangtua F 44.640 Sig. .000b Coefficientsa Model Unstandardized Coefficients Standardized t Sig. Coefficients B (Constant) Std. Error Beta 44.947 10.995 .622 .093 4.088 .000 6.681 .000 1 orangtua .784 Coefficientsa Model 95.0% Confidence Interval for B Lower Bound (Constant) Upper Bound 22.424 67.470 .431 .812 1 orangtua a. Dependent Variable: anak Residuals Statisticsa Minimum Predicted Value Maximum Mean Std. Deviation N 100.28 144.43 117.47 11.942 30 -16.881 19.280 .000 9.458 30 Std. Predicted Value -1.439 2.258 .000 1.000 30 Std. Residual -1.754 2.003 .000 .983 30 Residual a. Dependent Variable: anak Charts
