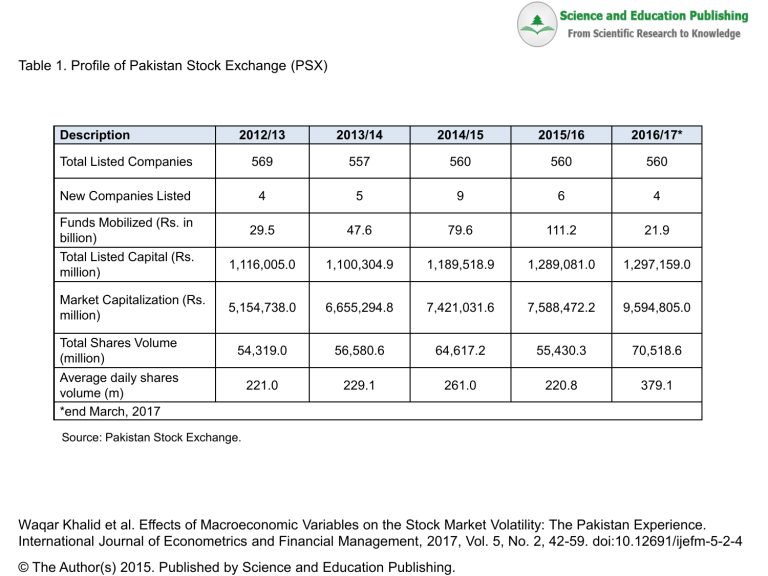
Table 1. Profile of Pakistan Stock Exchange (PSX) Description 2012/13 2013/14 2014/15 2015/16 2016/17* Total Listed Companies 569 557 560 560 560 New Companies Listed 4 5 9 6 4 29.5 47.6 79.6 111.2 21.9 1,116,005.0 1,100,304.9 1,189,518.9 1,289,081.0 1,297,159.0 5,154,738.0 6,655,294.8 7,421,031.6 7,588,472.2 9,594,805.0 54,319.0 56,580.6 64,617.2 55,430.3 70,518.6 221.0 229.1 261.0 220.8 379.1 Funds Mobilized (Rs. in billion) Total Listed Capital (Rs. million) Market Capitalization (Rs. million) Total Shares Volume (million) Average daily shares volume (m) *end March, 2017 Source: Pakistan Stock Exchange. Waqar Khalid et al. Effects of Macroeconomic Variables on the Stock Market Volatility: The Pakistan Experience. International Journal of Econometrics and Financial Management, 2017, Vol. 5, No. 2, 42-59. doi:10.12691/ijefm-5-2-4 © The Author(s) 2015. Published by Science and Education Publishing.
