Uploaded by
sayfelix
Predicting Customer Lifetime Value via Data Mining in Direct Selling
advertisement
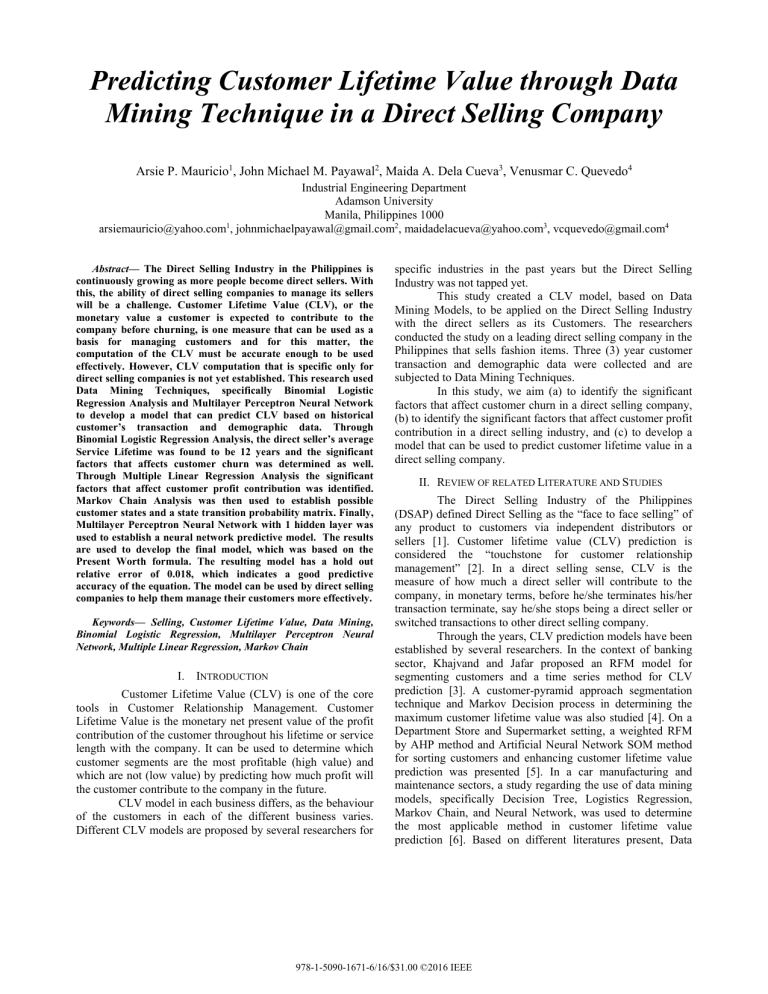
Predicting Customer Lifetime Value through Data Mining Technique in a Direct Selling Company Arsie P. Mauricio1, John Michael M. Payawal2, Maida A. Dela Cueva3, Venusmar C. Quevedo4 Industrial Engineering Department Adamson University Manila, Philippines 1000 [email protected], [email protected], [email protected], [email protected] Abstract— The Direct Selling Industry in the Philippines is continuously growing as more people become direct sellers. With this, the ability of direct selling companies to manage its sellers will be a challenge. Customer Lifetime Value (CLV), or the monetary value a customer is expected to contribute to the company before churning, is one measure that can be used as a basis for managing customers and for this matter, the computation of the CLV must be accurate enough to be used effectively. However, CLV computation that is specific only for direct selling companies is not yet established. This research used Data Mining Techniques, specifically Binomial Logistic Regression Analysis and Multilayer Perceptron Neural Network to develop a model that can predict CLV based on historical customer’s transaction and demographic data. Through Binomial Logistic Regression Analysis, the direct seller’s average Service Lifetime was found to be 12 years and the significant factors that affects customer churn was determined as well. Through Multiple Linear Regression Analysis the significant factors that affect customer profit contribution was identified. Markov Chain Analysis was then used to establish possible customer states and a state transition probability matrix. Finally, Multilayer Perceptron Neural Network with 1 hidden layer was used to establish a neural network predictive model. The results are used to develop the final model, which was based on the Present Worth formula. The resulting model has a hold out relative error of 0.018, which indicates a good predictive accuracy of the equation. The model can be used by direct selling companies to help them manage their customers more effectively. Keywords— Selling, Customer Lifetime Value, Data Mining, Binomial Logistic Regression, Multilayer Perceptron Neural Network, Multiple Linear Regression, Markov Chain I. INTRODUCTION Customer Lifetime Value (CLV) is one of the core tools in Customer Relationship Management. Customer Lifetime Value is the monetary net present value of the profit contribution of the customer throughout his lifetime or service length with the company. It can be used to determine which customer segments are the most profitable (high value) and which are not (low value) by predicting how much profit will the customer contribute to the company in the future. CLV model in each business differs, as the behaviour of the customers in each of the different business varies. Different CLV models are proposed by several researchers for specific industries in the past years but the Direct Selling Industry was not tapped yet. This study created a CLV model, based on Data Mining Models, to be applied on the Direct Selling Industry with the direct sellers as its Customers. The researchers conducted the study on a leading direct selling company in the Philippines that sells fashion items. Three (3) year customer transaction and demographic data were collected and are subjected to Data Mining Techniques. In this study, we aim (a) to identify the significant factors that affect customer churn in a direct selling company, (b) to identify the significant factors that affect customer profit contribution in a direct selling industry, and (c) to develop a model that can be used to predict customer lifetime value in a direct selling company. II. REVIEW OF RELATED LITERATURE AND STUDIES The Direct Selling Industry of the Philippines (DSAP) defined Direct Selling as the “face to face selling” of any product to customers via independent distributors or sellers [1]. Customer lifetime value (CLV) prediction is considered the “touchstone for customer relationship management” [2]. In a direct selling sense, CLV is the measure of how much a direct seller will contribute to the company, in monetary terms, before he/she terminates his/her transaction terminate, say he/she stops being a direct seller or switched transactions to other direct selling company. Through the years, CLV prediction models have been established by several researchers. In the context of banking sector, Khajvand and Jafar proposed an RFM model for segmenting customers and a time series method for CLV prediction [3]. A customer-pyramid approach segmentation technique and Markov Decision process in determining the maximum customer lifetime value was also studied [4]. On a Department Store and Supermarket setting, a weighted RFM by AHP method and Artificial Neural Network SOM method for sorting customers and enhancing customer lifetime value prediction was presented [5]. In a car manufacturing and maintenance sectors, a study regarding the use of data mining models, specifically Decision Tree, Logistics Regression, Markov Chain, and Neural Network, was used to determine the most applicable method in customer lifetime value prediction [6]. Based on different literatures present, Data 978-1-5090-1671-6/16/$31.00 ©2016 IEEE Mining is the most appropriate technique to use in CLV prediction. Data Mining is a means of “explaining the past and predicting the future” through the use of data analysis [7]. Data Mining uses mathematical models and algorithms to segment data and predict values through searching large collections of data to detect patterns and trends [8]. It should be noted that the field where Data Mining is used the most is CRM [9]. In this paper, the researchers used one type of Classification Data Mining Technique: Logistic Regression. Logistic Regression attempts to predict the probability that a certain binary event will happen. Logistic Regression enables a statistical analysis to overcome restrictions of linear regression. For example, in Logistic Regression, the dependent and independent variables can have no linear relationship and that the dependent variable and the error terms need not to be normally distributed [10]. Logistic Regression is similar to a linear regression except that it predicts a dichotomous dependent variable instead of a continuous one. Logistic Regression was used to predict the service life or the time before churn of each subject customer. The researchers also used one type of Regression Data Mining Technique: Artificial Neural Network (ANN). Neural Network, or more properly known as Artificial Neural Network, is based on the structure of a mammalian cerebral cortex where a neuron cell is stimulated by several inputs and can be activated by an outside process [11]. The overall process creates a predictive model that can be used even if linear relationship between variables are not present. Also, ANN has less assumptions and restrictions for data compared to other Data Mining Models. In this paper’s context, the ANN, specifically Multilayer Perceptron, was used to predict future customer contribution. Multilayer Perceptron (MLP) is the most famous ANN architecture as it can approximate any function. MLP has three distinct layers: the input layer, the hidden layers, and the output layer. It uses neurons that are capable of processing data using weights and activation functions, send data to the succeeding neuron, and propagating the error of preceding neurons, or back propagation [12]. MLP is an example of supervised training and its most common training algorithm is back propagation [13]. III. METHODOLOGY This research used a quantitative research design to solve the research questions presented. To solve the research problems, statistical techniques was applied, and thus required a quantitative design approach to the problem. The researchers used a correlational research design to determine the factors that affect customer churn and profit contribution. The first sampling design the researchers used was convenience sampling, to find the company that the researchers will conduct its study. The researchers sought the help of a leading direct selling company (Company A) in the Philippines to gather data to be used in the study. The researchers then used stratified random sampling where only the direct sellers transacting in Company A with at least 3 years in the business will be subjected for the study. The computed sample size is 51 participants. The 3 years transaction and demographic data of the 51 randomly chosen direct sellers were then provided to the researchers which totals to 4661 transactions. The researchers used software applications, specifically, Microsoft Excel and SPSS (Statistical Product and Service Solutions) to analyze and interpret data. The following are the research procedure that lead to answering the research questions. A. Data Gathering The researchers collected a 3-year transaction and demographic data of the randomly selected direct sellers. B. Estimation of Service Length through Churn Prediction Possible factors are extracted from the transaction and demographic data collected and were translated into variables. These variables were used as independent variables in the logistic regression analysis. A churn criteria was established to determine the churn status of the customer. The churn criteria was established by the subject company. The churn status was used as the dependent variable in the logistic regression analysis. Let Cs be the churn status of the customer where Cs = 0 indicates a not-churn customer and Cs = 1 indicates a churn customer The factors to be tested were divided into transaction and demographic data. The factors were the independent variable for the test while the Churn Status (Cs) was the dependent variable. The statistical software SPSS was used to aid the analysis. The researchers used the following parameters for the Logistic Regression Analysis in this study: CI for exp(B) is still 95%, Probability for Stepwise Entry = 0.05 and Removal = 0.10, Classification cutoff = 0.5, and maximum iterations = 20. The logistic regression equation model based on the analysis was then created and the model’s accuracy was tested. Then, the probability Pci that the churn status is equal to 1 for each of the selected direct sellers was computed using the formula Pci = eYi / (1 + eYi) (1) Where Yi is the Y score computed using the logistic regression generated. The mean churn probability Pc of all the customers was then computed. The probability of churn in a logistic regression follows a geometric distribution. The expected length L of observations before the first churn customer occurs is expressed by the formula L = 1 / Pc (2) C. Estimation of State Transition Probability From the transaction and demographic data, factors that can affect customer profit contribution prediction are identified. The factors were then translated into variables. The variables for significance in predicting profit contribution using multiple linear regression analysis were tested. The Net Sales was the dependent variable for the equation. The confidence intervals level under Regression Coefficients is 95% and the Probability of F under Stepping Method Criteria was used where Entry = .05 and Removal = .10. Using the significant variables identified, the possible customer states and next states were determined. Based on past transactions, the transition probabilities are computed and then a transition probability matrix P was created. An Identity matrix It that will be used as a matrix multiplier to indicate the current state of the direct seller was also created. D. Prediction of Customer Contribution Multilayer Perceptron Neural Network was then run using Net Sales as the dependent variable and the identified significant factors be the covariates. One hidden layer was used and the activation function used was identity type. 70%, 20%, and 10% was used as training, test, and hold out set for the model, respectively. The researchers used SPSS to perform Multilayer Perceptron Neural Network. The researchers chose to randomly assign cases based on relative numbers of cases for Partition Dataset. The number of hidden layer is one which has a Hyperbolic Tangent activation function. Under Output Layer, activation function is Identity and the rescaling of scale dependent variables is standardized. In this study, the type of training for MLP is online and the optimization algorithm is gradient descent. Under SPSS MLP options, user- missing values is excluded, maximum steps without a decrease in error is 1, the data to use for computing prediction error and maximum training epochs is automatic, the maximum training time is 15 minutes, the minimum relative change in training error is 0.0001, the minimum relative change in training error ratio is 0.001, and the maximum cases to store in memory is 1000. Based on the resulting Network diagram and synaptic weights, the Neural Network model equation Zt was established. The model’s accuracy was also tested. E. CLV Prediction Model The prevailing discount factor d in the market was determined. Using the Service Lifetime (L) computed in equation (2), Initial State Vector (It), Initial State Transition Probability (P), and Neural Network Model Equation (Zt), a model that will compute Customer Lifetime Value was then created. IV. DATA AND RESULTS A. Data Gathering The transaction data used are Dealer Code, Transaction Number, Transaction Month, Transaction Day of the Month, and Transaction Day of the Week, Gross Sales per Transaction, Discount, Returns, and Net Sales per Transaction. The demographic data gathered includes the Position, Age, and Gender of the direct sellers subject for this study. B. Estimation of Service Length through Churn Prediction The subject company consider their dealers as “churn” once they didn’t pay their debts within the allotted due date (within 40 days of the specified due date). Based on the Binomial Logistic Regression Analysis, the Average Expense per Visit and Average Return per Visit are significant in determining the likelihood that a customer will churn or not. The Nagelkerke R2 value or the variation of the dependent variable in the model is 62%. Overall, the full model can correctly predict 94.1% of the cases. Based on the average Pci, the model predicted that the churn probability Pc of a customer is 0.0892. The Estimated Service Length L of the customers is therefore 12 years. This means that the average length of time before a customer stops transaction is 12 years. C. Estimation of State Transition Probability Through Multiple Linear Regression Analysis, the adjusted R² of the regression model is 0.995 with the R² = .995. This implies that the independent variables explain 99.5% of the variation in the dependent variable, Net Sales. Position, Frequency of Visit per Month, Expense per Visit, Discount per Visit, and Return per Visit are statistically significant since their p-value < .05 (alpha level). The factors Position, Frequency of Visit per Month, Expense per Visit, Discount per Visit, and Return per Visit, were subjected to state transition probabilities. Since Position depends on the accumulated gross sales he/she made during 2 consecutive months. Only the variables Average Expense per Visit, Average Discount per Visit, Average Return per Visit, and Frequency of Visit per month were used to define customer states. This means that there are 4 dimensions for each State. To reduce the number of possible states, the continuous variables are further divided into classes. This results to a total of 672 possible customer states. An Initial State Vector It needs to be set to indicate at what state the customer is during time t. The Estimated Service Lifetime of the customers is 12 years which means that there are 672 different It. The customer states identified will then be subjected to Markov Chain analysis to determine the customer state transition probability P. D. Prediction of Customer Contribution SPSS software was also used to aid the analysis of Multilayer Perceptron Neural Network. The significant factors that affect customer profit contribution are the Independent Variables while the Net Sales is the Dependent Variable. A network diagram was generated by the Neural Network analysis. There are 6 sources of input (Bias, Position, Frequency of Visit, Ave. Expense per Visit, Ave. Discount per Visit, and Ave. Return per Visit) which will be activated by the 4 hidden layer nodes through a Hyperbolic tangent activation function along with the assigned synaptic weights. The results of each the 4 hidden nodes are subjected to an identity function and the output (Net Sales) are generated through the sum of these resulting values. Table (1) shows the synaptic weights of each of the nodes from the input layer to the hidden layer and from hidden layer to the output layer. From the network diagram, the formula is generated, shown on equation (3). (3) Where ri is the input of factor i, wi is the synaptic weight from input i to hidden layer, and vj is the synaptic weight from hidden layer j to the output node. The model has a Training Relative Error of 0.151, a Testing Relative Error of 0.014, and a Hold out Relative Error of 0.018. The values are a good indicator of model accuracy. E. CLV Prediction The customer lifetime value is the present worth of all the predicted customer contribution in the future during their service lifetime. The predicted Customer Lifetime Value (CLV) is computed using equation (4) Table 1 Synaptic Weights for Artificial Neural Network (4) Predicted Predictor Hidden Layer 1 H(1:1) H(1:3) (Bias) -.121 -.534 -.690 Position .133 -.043 .024 .085 .037 -.057 .695 .606 .635 1.212 -.246 -.226 -.205 -.132 -.173 Frequency Input of Visit Layer Expense per Visit Discount per Visit Return per Visit Hidden H(1:2) Output Layer Net Sales (Bias) 1.608 H(1:1) .262 H(1:2) 1.423 H(1:3) 1.548 Layer 1 Where It is the Identity matrix used in time t, P is the transition probability matrix, Zt is the predicted customer contribution at time t, and d is the discount rate in the market. V. CONCLUSION With the use of Binomial Logistic Regression, the researchers identified that the Average Expense per Visit and Average Return per Visit are the significant factors that affect customer churn in a direct selling industry. These are the only factors associated with the likelihood of churn. Also, the probability that a customer will churn using Binomial Logistic Regression is 0.0892. The Binomial Logistic Regression Analysis was found to have a good prediction accuracy in classifying churn and not-churn customers which is 94.1%. The model generated is therefore accurate and reliable. Based on the computed churn probability, the expected Service Lifetime L of the Customer is found to be . This means that on average, a customer will churn within 12 years of transaction with the company. With the use of Multiple Linear Regression, the researchers identified that Position, Frequency of Visit per Month, Expense per Visit, Discount per Visit, and Return per Visit are the significant factors that affect customer profit contribution. The Multiple Linear Regression model generated from the analysis was found to have a good fit of data. Based on the significant factors determined, a Neural Network was created to predict customer profit contribution. Neural Networks are used because of its ease of use but an accurate and reliable prediction can be obtained. The resulting Neural Network model, based on a feed forward Multilayer Perceptron Analysis with 1 hidden layer and a hyperbolic tangent hidden layer function and an identity output function. The model has a Training Relative Error of 0.151, a Testing Relative Error of 0.014, and a Hold out Relative Error of 0.018 which indicates a good prediction model. The Identity matrix is a 1 x 672 matrix that denotes the state of a customer at time t. The transition probability matrix is a 672 x 672 square matrix that shows the probability that a customer will shift from one state to another for the next year t. The discount factor is prevailing the interest rate of money. The predictive model can be used by the company to compute for the Customer Lifetime Value of each customers. [3] [4] [5] VI. RECOMMENDATION The computed CLV using the developed model should be used and interpreted correctly by the company. Otherwise, the CLV will not be useful at all. The company can also use the results of the significance test to prevent customers from the likelihood of churn and/or to improve the customer’s profit contribution. The company’s marketing strategy can be based on the computed CLV. The company should also be able to improve the model through the acquisition of more data, use of other techniques, increase of sample size, and a larger time scope. For further studies, the product details such as type of product purchased, quantity of product purchased and its specifications can also be included for additional significant factors to be tested. A deeper look at the factors might also extract data that the Data Mining techniques might find significant in both customer churn status and profit contribution. Determining possible customer states became extensive with the use of Markov Chain analysis as the said method accepts only one dimension variables. Multiple variables are likely to be involved in representing a customer state when this model is applied to other companies making the Markov chain model unmanageable (four, in this research’s case). In order to resolve this problem, System dynamic or Petri net might be used to model a customer’s future purchasing behaviour as proposed by Cheng et.al. Also, the Data Mining techniques used in this study such as Binomial Logistic Regression, Multiple Linear Regression, and Multilayer Perceptron Neural Network can be improved for more accurate results by integrating other data mining techniques such as Support Vector Machine (SVM). According to literatures, this type of data mining is a complex algorithm and time consuming but if used correctly and if given more time it will also give good prediction accuracy. A bigger sample size and a larger time scope can be used as input for the study to increase the accuracy of the results of the model. The study can also include different companies with similar line of business to make the result generalized for the whole direct selling industry under the garments line of products. [6] [7] [8] [9] [10] [11] [12] [13] [14] [15] [16] [17] [18] [19] REFERENCES [1] [2] DSAP. (n.d.). Definition of Direct Selling and MLM vs Pyramiding. DSAP. Retrieved from http://www.dsap.ph/definition-of-direct-sellingand-mlm-vs-pyramiding.html Chen, X. (2006). Customer Lifetime Value: An Integrated Data Mining Approach. Lingnan University. [20] Khajvand, M., & Jafar, M. (2011). Procedia Computer Science Estimating customer future value of different customer segments based on adapted RFM model in retail banking context. Procedia Computer Science, 3, 1327–1332. doi:10.1016/j.procs.2011.01.011 Ekinci, Y., Ülengin, F., Uray, N., & Ülengin, B. (2014). Analysis of customer lifetime value and marketing expenditure decisions through a Markovian-based model. European Journal of Operational Research, 237(1), 278–288. doi:10.1016/j.ejor.2014.01.014 Ekinci, Y., Ülengin, F., Uray, N., & Ülengin, B. (2014). Analysis of customer lifetime value and marketing expenditure decisions through a Markovian-based model. European Journal of Operational Research, 237(1), 278–288. doi:10.1016/j.ejor.2014.01.014 Cheng, C.-J. C.-B., Chiu, S. W. W., & Wu, J.-Y. (2012). Customer lifetime value prediction by a Markov chain based data mining model: Application to an auto repair and maintenance company in Taiwan. Scientia Iranica, 19(3), 849–855. doi:10.1016/j.scient.2011.11.045 Sayad, S. (2010). Data Mining (pp. 1–25). Oracle ® Data Mining. (2008), 1(May). Poll Data Mining Applications in 2008. (2008). KDNuggets. Fadlalla, A. (2005). An experimental investigation of the impact of aggregation on the performance of data mining with logistic regression. Information & Management, 42(5), 695–707. doi:10.1016/j.im.2004.04.005 Dolhansky, B. (2013). Artificial Neural Networks: Linear Regression (Part 1). Retrieved February 04, 2015, from http://briandolhansky.com/blog/artificial-neural-networks-linearregression-part-1 Fragkaki, A. G., Farmaki, E., Thomaidis, N., Tsantili-Kakoulidou, A., Angelis, Y. S., Koupparis, M., & Georgakopoulos, C. (2012). Comparison of multiple linear regression, partial least squares and artificial neural networks for prediction of gas chromatographic relative retention times of trimethylsilylated anabolic androgenic steroids. Journal of Chromatography. A, 1256, 232–9. doi:10.1016/j.chroma.2012.07.064 Chen, X. (2006). Customer Lifetime Value: An Integrated Data Mining Approach. Lingnan University. Cheng, C.-J. C.-B., Chiu, S. W. W., & Wu, J.-Y. (2012). Customer lifetime value prediction by a Markov chain based data mining model: Application to an auto repair and maintenance company in Taiwan. Scientia Iranica, 19(3), 849–855. doi:10.1016/j.scient.2011.11.045 Dolhansky, B. (2013). Artificial Neural Networks: Linear Regression (Part 1). Retrieved February 04, 2015, from http://briandolhansky.com/blog/artificial-neural-networks-linearregression-part-1 DSAP. (n.d.). Definition of Direct Selling and MLM vs Pyramiding. DSAP. Retrieved from http://www.dsap.ph/definition-of-direct-sellingand-mlm-vs-pyramiding.html Ekinci, Y., Ülengin, F., Uray, N., & Ülengin, B. (2014). Analysis of customer lifetime value and marketing expenditure decisions through a Markovian-based model. European Journal of Operational Research, 237(1), 278–288. doi:10.1016/j.ejor.2014.01.014 Fadlalla, A. (2005). An experimental investigation of the impact of aggregation on the performance of data mining with logistic regression. Information & Management, 42(5), 695–707. doi:10.1016/j.im.2004.04.005 Fragkaki, A. G., Farmaki, E., Thomaidis, N., Tsantili-Kakoulidou, A., Angelis, Y. S., Koupparis, M., & Georgakopoulos, C. (2012). Comparison of multiple linear regression, partial least squares and artificial neural networks for prediction of gas chromatographic relative retention times of trimethylsilylated anabolic androgenic steroids. Journal of Chromatography. A, 1256, 232–9. doi:10.1016/j.chroma.2012.07.064 García Nieto, P. J., Martínez Torres, J., de Cos Juez, F. J., & Sánchez Lasheras, F. (2012). Using multivariate adaptive regression splines and multilayer perceptron networks to evaluate paper manufactured using Eucalyptus globulus. Applied Mathematics and Computation, 219(2), 755–763. doi:10.1016/j.amc.2012.07.001
